
Esta obra está bajo una Licencia Creative Commons Atribución-NoComercial 4.0 Internacional.
Recepción: 24 Agosto 2024
Aprobación: 12 Marzo 2025
Publicación: 16 Julio 2025
DOI: https://doi.org/10.36517/contextus.2025.94001
Abstract:
Background: Among the most relevant accounting indicators for understanding corporate characteristics and supporting decision-making, metrics focused on operational activities stand out. These indicators may offer greater efficiency in predicting stock returns, as they encompass a business's core transactions and provide a more accurate representation of a firm's financial condition.
Purpose: This study investigates the explanatory power of residual operating income—measured by the Return on Net Operating Assets (RNOA) and the Weighted Average Cost of Capital (WACC)—on stock returns. It hypothesizes the existence of a significant relationship between stock returns and residual operating income.
Method: Data were collected from companies listed on B3 — excluding financial institutions, holding companies, real estate funds, and investment vehicles—via the Refinitiv Eikon© system from 2015 to 2022. The final sample comprised 1,224 observations. Statistical tools employed include descriptive analysis, correlation matrix, quantile regression, and time series analysis.
Results: The findings indicate that residual operating income explains stock returns in the 0.25 and 0.75 quantiles, suggesting the proposed metric's predictive power. The impact of the COVID-19 pandemic proved significant across all quantiles, highlighting its relevance to financial markets. Time series analysis revealed that stock returns closely tracked residual operating income throughout the study period, except in 2017 and 2022.
Conclusions: This study contributes to the accounting literature by introducing a novel metric for the Brazilian context and offers practical implications for financial markets. By incorporating only the essential elements of business activity—while avoiding distortion from non-operational data—this metric supports more informed decisions by investors, financial analysts, and managers, enabling enhanced analysis and decision-making processes.
Keywords: residual income, operational performance, stock returns, RNOA, WACC.
Resumo:
RESUMO Contextualização: Entre os indicadores contábeis mais relevantes para a compreensão das características das empresas e para a tomada de decisões, destaca-se o uso de métricas focadas nas atividades operacionais. Essas métricas podem sugerir maior eficiência na predição dos retornos das ações, uma vez que contemplam transações essenciais do negócios, além de fornecerem uma visão mais precisa da situação da empresa.
Objetivo: O objetivo do estudo foi investigar o poder explicativo do lucro residual operacional, mensurado a partir do retorno sobre os ativos operacionais líquidos (RNOA) e do custo médio ponderado de capital (WACC) das companhias, sobre o retorno das ações, tendo como hipótese a existência de relação significativa entre o retorno das ações e o lucro residual operacional.
Método: Os dados das empresas listadas na B3, exceto financeiras, holdings, fundos imobiliários e participações, foram coletados do sistema Refinitiv Eikon © entre o período de 2015 e 2022, com amostra final de 1224 observações. Para análise dos dados, utilizou-se ferramentas estatísticas como análise descritiva, matriz de correlação, regressão quantílica e séries temporais.
Resultados: Os resultados evidenciam que o lucro residual operacional explica o retorno das ações nos quantis 0,25 e 0,75, sugerindo o poder preditivo da métrica desenvolvida no estudo. O efeito da Covid-19 se mostrou relevante em todos os quantis, indicando a relevância da pandemia para o mercado financeiro. A comparação de Séries Temporais revelou que o retorno segue a mesma tendência do lucro residual operacional ao longo do período analisado, com exceção dos anos de 2017 e 2022.
Conclusões: O estudo contribui para o enriquecimento da literatura contábil, ao trazer uma nova métrica de pesquisa para o Brasil, bem como contribui para o mercado financeiro, uma vez que a partir da utilização da ferramenta, que engloba as informações essenciais do negócio, sem contaminar as evidências contábeis, é possível subsidiar a tomada de decisão dos investidores, analistas financeiros e gestores, proporcionando melhor análise e tomada de decisão.
Palavras-chave: lucro residual, desempenho operacional, retorno de ações, RNOA, WACC.
Resumen:
RESUMEN Contextualización: Entre los indicadores contables más relevantes para comprender las características de las empresas y para la toma de decisiones, destaca el uso de métricas centradas en las actividades operativas. Estas métricas más robustas pueden sugerir una mayor eficiencia en la predicción de los rendimientos de las acciones, ya que contemplan transacciones esenciales del negocio y proporcionan una visión más precisa de la situación de la empresa.
Objetivo: El objetivo del estudio fue investigar el poder explicativo del beneficio operativo residual, medido por el retorno sobre los activos operativos netos (RNOA) y el costo promedio ponderado de capital (WACC), sobre los rendimientos de las acciones, planteando la hipótesis de una relación significativa entre los rendimientos de las acciones y el beneficio operativo residual.
Método: Se recopilaron datos de empresas cotizadas en la B3, excluyendo financieras, holdings, fondos inmobiliarios y participaciones, del sistema Refinitiv Eikon ©, para el período de 2015 a 2022, con una muestra final de 1,224 observaciones. Para el análisis de datos, se utilizaron herramientas estadísticas como análisis descriptivo, matriz de correlación, regresión cuantil y series temporales.
Resultados: Los resultados evidenciaron que la utilidad residual operativa explica el rendimiento de las acciones en los cuantiles 0,25 y 0,75, sugiriendo el poder predictivo de la métrica desarrollada en el estudio. El efecto de la Covid-19 fue relevante en todos los cuantiles, subrayando su importancia para el mercado financiero. El análisis de series temporales reveló que los rendimientos siguen la misma tendencia que la utilidad residual operativa durante el período analizado, excepto en los años 2017 y 2022.
Conclusiones: El estudio contribuye al enriquecimiento de la literatura contable al introducir una nueva métrica de investigación para Brasil y beneficia al mercado financiero. Esta herramienta, que integra la información esencial del negocio sin comprometer la evidencia contable, apoya la toma de decisiones de inversores, analistas financieros y gestores, conduciendo a un análisis y decisiones más efectivos.
Palabras clave: beneficio residual, desempeño operativo, rendimientos de acciones, RNOA, WACC.
1 INTRODUCTION
Given the high degree of speculation in financial markets — uncertainty about future scenarios contributes to the difficulty of accurately determining asset values — various analytical techniques and methods are employed to support decision-making processes (Carvalho et al., 2023).
In this context, users of accounting information who rely on a fundamentalist approach must associate data extracted from financial statements with market indicators to bridge the company's past and future (Malta & Camargos, 2016). Accounting indicators, particularly those linked to profitability and emphasized by Wang et al. (2013), are robust. Furthermore, stock return is one of publicly traded companies' most relevant financial indicators. Thus, the need to mitigate the risk associated with exposure to variable income leads investors to increasingly seek methods to predict such returns (Santos et al., 2018).
Previous studies have examined the predictive ability of residual income and profitability indicators to explain stock returns (Campos et al., 2012; Pletsch & Ritta, 2018). Although these studies use Return on Assets (ROA) as a measure of profitability, theoretical and empirical evidence suggests that the Return on Net Operating Assets (RNOA) offers a more precise perspective, as ROA includes non-operating assets and economic transactions unrelated to the firm's core business, which may distort the assessment of a company's true profitability (Klingenberg et al., 2013; Nissim & Penman, 2001; Vorst & Yohn, 2018).
Since RNOA captures only operating income and assets—excluding financing, investment, and other non-operating activities—it may be a more powerful tool for predicting profitability. This is because it reflects how efficiently a firm utilizes its operating assets, i.e., those related to its core business, which investors can perceive positively (Nissim & Penman, 2001; Vorst & Yohn, 2018).
Santos et al. (2018) identified a correlation between residual income, derived from Economic Value Added (EVA), and stock returns, while Bastos et al. (2019) found results indicating a relationship between operating cash flows and earnings per share with stock returns.
However, previous research generally calculated EVA using the Capital Asset Pricing Model (CAPM), third-party capital costs, or opportunity costs (Subedi & Farazmand, 2020; Santos et al., 2018). The approach adopted in this study emphasizes a more comprehensive method, as it utilizes the Weighted Average Cost of Capital (WACC), which incorporates both debt and equity. Therefore, calculating EVA using RNOA and WACC is expected to produce a robust value-creation indicator that may be more useful due to its greater predictive power for managers, investors, and analysts (Nissim & Penman, 2001).
Despite studies suggesting a positive relationship between returns, share prices, market value, and profitability in the Brazilian market (Bastos et al., 2009; Bastos et al., 2019; Carvalho et al., 2023; Guastin & Pianca, 2022; Malta & Camargos, 2016; Pletsch & Ritta, 2018; Santos et al., 2018; Soares & Galdi, 2011), others do not corroborate this association, such as Campos et al. (2012) and Oliveira et al. (2017). Given the inconclusive nature of the literature and the limited exploration of this topic in Brazil, this study aims to investigate the explanatory power of residual operating income—measured by RNOA and WACC—on stock returns. Additionally, it seeks to determine whether a significant relationship exists between stock returns and residual operating income.
In addition to contrasting previous findings and addressing the lack of exploration in the Brazilian literature, this research provides a novel perspective by combining two distinct metrics: profitability (RNOA) and value creation (the difference between RNOA and WACC, i.e., residual operating income). These metrics apply to both academic researchers and market practitioners. The study's findings assist analysts, investors, and managers make more strategic and effective decisions.
Given the practical contributions that fundamental analysis can offer to the financial market ecosystem, this study investigates the explanatory power of residual operating income—calculated using RNOA and WACC—on stock returns. The econometric model developed includes the following control variables: ROA, Liquidity (LIQ), Leverage (LEV), Size (SIZE), and COVID-19 (COVID).
Initially, it is assumed that analyzing stock returns based on residual operating income can offer a more consistent and assertive perspective, as it focuses on net operating assets, excluding non-recurring and extraordinary elements, in line with the approach proposed by Nissim and Penman (2001).
The empirical tests use data obtained from the Refinitiv Eikon© system. The population includes companies listed on the Brazilian stock exchange B3, excluding financial firms, holding companies, investment vehicles, and real estate funds, covering the period from 2015 to 2022. Given the uniqueness of B3, the sample is non-probabilistic. The initial dataset comprised 4,128 observations, which was reduced to 1,224 after data cleaning, excluding data from 2010 to 2014 and companies without available information. Data analysis was conducted using RStudio and Microsoft Excel.
The results indicate that residual operating income is positively and significantly related to stock returns at the 0.25 and 0.75 quantiles for companies listed on the Brazilian stock market. Time series analysis revealed that stock returns followed the same trend as residual operating income, except in 2017 and 2022.
In addition to this introduction, the article includes: Section 2, which presents the literature review and research hypothesis; Section 3, which details the data and methodology; Section 4, which discusses the results and additional tests; and Section 5, which concludes the study with limitations and suggestions for future research.
2 THEORETICAL FRAMEWORK
2.1 Valuation Model, Signaling Theory, and Efficient Market Hypothesis
Kothari and Wasley (2019), in their review of fifty years of scientific research on capital markets, highlight the Ohlson (1995) valuation model as the most widely adopted among existing models. According to Ohlson (1995), a company’s equity value derives from current and future earnings and dividends. From this theoretical model arises the concept of residual income, defined as net income minus the cost of capital (Ohlson, 1995).
The accounting literature suggests that residual income, based on Ohlson’s (1995) model, can predict stock prices and returns (Collins et al., 1997; Lopes, 2001; Nissim & Penman, 2001). O’Hanlon and Peasnell (2002) argue that excess residual income can be understood as a value-adding factor for the firm. Feltham and Ohlson (1995), in refining Ohlson’s model, separate net assets into operating and financial components, noting that since the book and market values of financial assets are equivalent, their residual income equals zero. Thus, the model focuses on operating activities as the primary source of firm value.
Nissim and Penman (2001) demonstrate that residual operating income—calculated using RNOA and WACC—has greater explanatory power for stock returns. This is because it captures clean operating income, excluding extraordinary and non-recurring transactions, and accounts for equity and debt capital costs. This approach is considered more robust than Ohlson’s (1995) version, which includes only the cost of equity.
Morris (1987), in discussing signaling theory, posits that firms send signals to the market through their financial disclosures. According to Suhadak et al. (2018), corporate disclosures allow the market to differentiate between high- and low-quality firms. Based on this premise, it is argued that operational information may have a stronger relationship with stock returns than purely financial data, positioning residual operating income as a value-creation tool (O’Hanlon & Peasnell, 2002; Soares & Galdi, 2011).
For Amir et al. (2011), RNOA emerges as a predictive tool for future abnormal returns. In this perspective, the findings challenge the Efficient Market Hypothesis (EMH), which asserts that all relevant public or private information is fully reflected in asset prices, making it impossible to consistently earn above-average returns (Fama, 1970).
Thus, residual operating income can be understood as a fundamentalist metric that supports a deeper investigation into anomalies in EMH. It is a decision-making tool for investors by hypothesizing that it can explain future abnormal returns and reduce information asymmetry, as proposed by signaling theory and firm valuation models.
2.2 Stock Returns and Residual Operating Income
Accounting information is essential for conducting fundamental analysis of publicly traded companies, as it supports firm valuation through data derived from financial statements (Nissim & Penman, 2001). Company valuation is critical for stakeholders, as it aids in strategic decision-making (Bastos et al., 2009; Bastos et al., 2019; Campos et al., 2012; Carvalho et al., 2023; Guasti & Pianca, 2022; Malta & Camargos, 2016; Oliveira et al., 2017; Pletsch & Ritta, 2018; Soares & Galdi, 2011).
Among accounting indicators, profitability measures are among the most relevant for investors (Wang et al., 2013). Despite the importance of accounting in equity markets, empirical findings remain inconclusive (Nissim & Penman, 2001). While studies such as Bastos et al. (2009), Bastos et al. (2019), Carvalho et al. (2023), Guastin & Pianca (2022), Malta & Camargo (2016), Pletsch & Ritta (2018), Santos et al. (2018), and Soares & Galdi (2011) suggest a positive relationship between stock returns, share price, market value, and profitability, others—such as Campos et al. (2012) and Oliveira et al. (2017)—found no significant association between profitability and stock returns.
Nissim and Penman (2001) sought to assess the usefulness of financial ratios in firm valuation using cross-sectional and time series analysis with a sample of U.S. companies from the Compustat system covering the period 1963 to 1999. Their results indicated that residual income is capable of predicting future returns.
Malta and Camargos (2016) conducted research with companies listed in the IBrX100 index between 2007 and 2014, finding a positive and significant relationship between stock returns and the ROA and ROE indicators. These findings reinforce those of Pletsch and Ritta (2018), who analyzed firms listed on the IBrX100 between 2008 and 2013.
Santos et al. (2018) examined the relationship between residual income—operationalized using EVA—and stock returns of companies listed on B3 over six years using a random-effects panel data regression model. Their findings indicated correlations between stock returns and ROA, aligning with previous studies (Bastos et al., 2009; Soares & Galdi, 2011).
To assess the relevance of accounting information, Bastos et al. (2019) investigated whether Operating Cash Flow (OCF) and Earnings per Share (EPS) can explain variations in stock prices. The sample from the Economatica system included Brazilian companies listed on B3 between 2010 and 2016. Using descriptive statistics and multiple linear regression, the study found that OCF explains variation in preferred shares, while EPS predicts changes in both common and preferred shares.
Accounting data has also proven relevant in explaining stock price reactions during crises (Carvalho et al., 2023). Guasti and Pianca (2022) emphasize a significant association between profitability ratios and stock returns, although the direction of significance varies (positive or negative) across sectors such as healthcare, utilities, and basic materials—even in crisis periods like COVID-19.
Therefore, the association between profitability, traditional residual income, and stock returns may become more consistent and relevant for stakeholders when analyzing stock performance in conjunction with residual operating income—operationalized through RNOA. This metric focuses solely on operating assets, i.e., the core elements of business activity, and excludes non-recurring transactions and extraordinary items (Nissim & Penman, 2001).
2.3 Research Hypothesis
The literature suggests that the quality of accounting information plays a fundamental role in decision-making and reducing information asymmetry, thereby mitigating agency conflicts (Jensen & Meckling, 1976). Furthermore, high-quality information signals the adoption of sound practices in preparing financial statements for the market (Morris, 1987; Suhadak et al., 2019). Among accounting indicators, profitability metrics are considered the most relevant by investors, as noted by Wang et al. (2013). This relevance is enhanced when using RNOA, which incorporates key operational aspects of the firm (Nissim & Penman, 2001).
Nissim and Penman (2001) found a relationship between residual income and stock returns. However, Soares and Galdi (2011) observed that ROA demonstrates greater predictive power than RNOA. These authors also noted that operational information holds more relevance for investors than financial indicators.
Bastos et al. (2019) reported that net income has the lowest predictive power for explaining market returns among Return on Investment (ROI), EPS, and OCF, which contrasts with the findings of Nissim and Penman (2001). Divergences in results found in the literature may be attributed to differences in economic, political, and institutional environments across countries (Carvalho et al., 2023).
While some studies suggest a positive relationship between stock returns in the Brazilian equity market and profitability, others do not identify such an association. Given these inconclusive findings and the scarcity of research on the subject in Brazil, the present study proposes the following hypothesis:
H1: There is a significant relationship between stock returns and residual operating income.
It is essential to note the limitations of this hypothesis, considering that this topic remains exploratory in the Brazilian context. As such, it is not possible to assert whether the relationship between the key variables is positive or negative nor to anticipate the possibility of abnormal returns through "Long and Short" strategies or the mean reversion anomaly of Net Operating Assets (NOA) (Fama & French, 2000).
3 METHODOLOGY
3.1 Research Design
This study adopts a theoretical-empirical approach to achieve its objectives through statistical analysis tools (Bastos et al., 2019; Santos, 2018). Regarding its purpose, the research is classified as exploratory and descriptive, seeking to enhance the understanding of residual operating income in Brazil and its relationship with stock returns (Carvalho et al., 2023; Oliveira, 2017; Pletsch & Ritta, 2018).
The research adopts a quantitative approach, aiming to accurately describe the relationship between the afore mentioned phenomena in the Brazilian capital market (Carvalho et al., 2023; Oliveira, 2017). The methodological procedures include bibliographic and documentary research based on academic books, scientific articles, corporate documents, and accounting procedures (Oliveira, 2017; Pletsch & Ritta, 2018).
3.2 Data
The data were collected from the Refinitiv Eikon© system. The population comprises all companies listed on B3, excluding financial institutions, holding companies, investment entities, real estate funds, and companies without available data, covering the period from 2015 to 2022. The variables were extracted from annual financial statements. The data were structured into a balanced panel and analyzed using RStudio and Microsoft Excel.
The sample is non-probabilistic, given that B3 is the sole stock exchange in Brazil. The exchange's importance for the country's economic development, along with the availability of data, justifies this sampling strategy. The initial dataset contained 4,128 observations, which was reduced to 1,224 after data cleaning. Notably, data from 2010 to 2014 were excluded due to insufficient availability.
Table 1 below summarizes the population, sample, exclusions, and total number of observations.
Research Data from 2010 to 2022

Source: Authors’ elaboration.
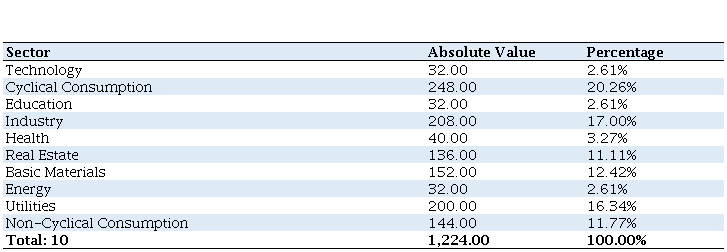
Table 2 presents the sectoral distribution of the observations for the period analyzed, both in absolute terms and as percentages.
Observations by Sector (2015–2022)
Source: Authors’ elaboration.
3.3 Econometric Model
To fulfill the study’s objective, empirical tests were conducted to assess whether a significant relationship exists between residual operating income (ROI) and stock returns (R). ROI is calculated according to Equation (1), while stock return is defined in Equation (2). In the model, stock return is the dependent variable, and ROI is the primary independent variable.
 (1)
 (1.1)
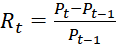 (2)
The control variables included in the model are: 1) ROA – more profitable firms tend to yield higher returns (Carvalho et al., 2023; Malta & Camargo, 2016; Santos et al., 2018); 2) Current Liquidity (CL) – firms that meet short-term obligations may generate ampler shareholder value (Carvalho et al., 2023; Malta & Camargo, 2016); 3) Leverage (LEV) – highly indebted firms are often associated with lower returns (Guastin & Pianca, 2022; Malta & Camargo, 2016; Soares & Galdi, 2011; Subedi & Farazmand, 2020); 4) Size (SIZE) – larger firms may influence stock prices more strongly (Bastos et al., 2019; Carvalho et al., 2023; Santos et al., 2018); 5) COVID-19 (COVID) – the pandemic is assumed to have had a significant impact on firm performance (Carvalho et al., 2023).
Table 3 summarizes the variables, acronyms, measurements, expected signs, and references:
Variables of the Econometric Model
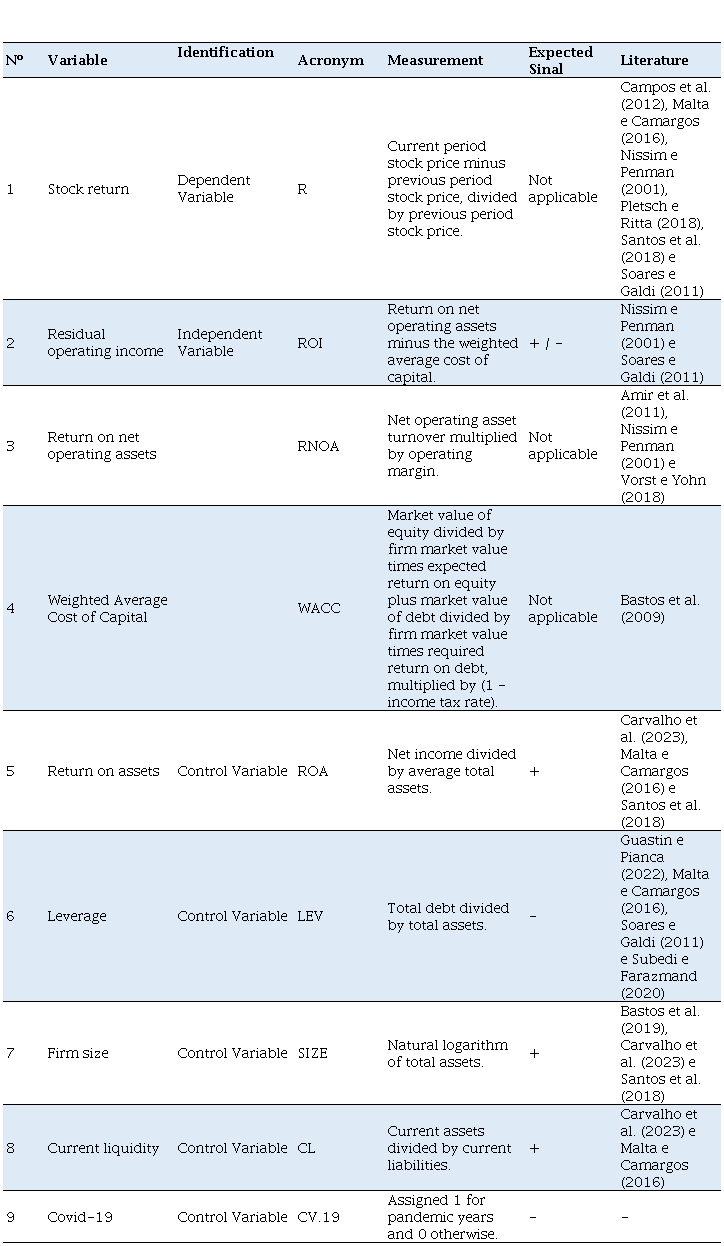
Source: Author's elaboration.Note: R is stock return; RNOA is return on net operating assets; WACC is weighted average cost of capital; ROI is residual operating income; ROA is return on assets; LEV is leverage; SIZE is firm size; CL is current liquidity; COVID19 refers to the Covid-19 pandemic.
After measuring the regression's primary research and control variables, the econometric model described in equation (3) is tested. The coefficients of this regression were estimated using the quantile regression approach for panel data.
 (3)
Where R is the stock return, ROI is the residual operating income, ROA is the return on assets, LEV is leverage, SIZE is the size of the firm, CL is current liquidity, CV.19 is a binary variable to control for the Covid-19 pandemic, where 1 refers to the years during the pandemic period and 0 otherwise, 𝛽𝑛 are the parameters, 𝜀 are the model residuals, 𝑖 refers to the firms, and 𝑡 to the period.
3.4 Time Series: ARIMA Model
As an additional test, the trends of stock returns and operating residual income over the years were analyzed (Marteletto, 2022). For this purpose, the time series analysis statistical tool was employed, using the Autoregressive Integrated Moving Average (ARIMA) model. This model is useful for identifying the behavior of variables over time and forecasting their future values (Souza et al., 2022).
The ARIMA model is well known for its forecasting capabilities. By applying this model to the variables in question, it becomes possible to understand their trends and open possibilities for predicting future returns. This, in turn, supports the planning of financial strategies such as “Long and Short” and the generation of abnormal returns through mean reversion. This is feasible because ARIMA can transform non-stationary series into stationary ones by adjusting the model to more robust temporal patterns (Souza et al., 2022).
In this context, the ARIMA time series model was tested using Equation (4) to understand the behavior of the variables, as this study does not intend to forecast future values.
 (4)
Where R is the stock return, ROI é is the operating residual income, Φ are the autoregressive coefficients, θ are the moving average coefficients, δ are the coefficients capturing the effect of past operating residual income on stock returns, ε are the residuals, t refers to the time period, and p, q, and r are the orders of the autoregressive, moving average, and operating residual income regression components, respectively.
4 ANALYSIS AND DISCUSSION OF RESULTS
4.1 Data Processing
The data were initially collected from the Refinitiv Eikon © system from 2010 to 2022, totaling 4,128 observations. However, those five years were excluded from the analysis due to a lack of information on many entities between 2010 and 2014. As a result, the final sample consists of 1,224 observations. It is essential to highlight that this sample represents the population, as it exceeds the minimum recommended number of 30 observations according to statistical theory (Cameron & Trivedi, 2005).
The data were organized as a balanced panel using Excel, following the studies of Guasti and Pianca (2022) and Malta and Camargo (2016). The control variables RNOA and WACC were removed from the model due to multicollinearity issues and poor model fit, as such conditions may render the results inefficient and/or biased (Cameron & Trivedi, 2005). Statistical tests were conducted using RStudio and Microsoft Excel. The function "influence.measures" was applied to eliminate influential observations.
In the fixed effects model, sectors were treated as fixed, assuming they do not vary over time. In the restricted model, only the study's main variables were tested. In the unrestricted model, control variables were added. Additionally, considering that crises may alter investor perception of the stock market, a dummy variable was included to account for the impact of COVID-19 (Carvalho et al., 2023).
4.2 Descriptive Statistics of Numerical Variables
For the descriptive analysis of numerical variables, two measures of central tendency (mean and median), the standard deviation (as a measure of dispersion), and the maximum and minimum values observed in the data were used.
Descriptive Statistics of the Research Variables
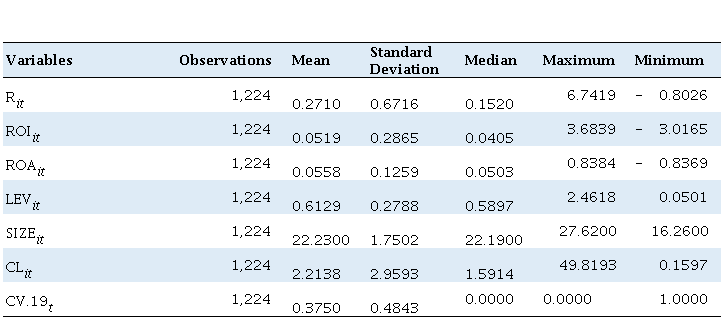
Source: Author's elaboration.Note: R is stock return; ROI is residual operating income; ROA is return on assets; LEV is leverage; SIZE is firm size; CR is current ratio; CV-19 is the pandemic dummy; i is the firm in period t.
Table 4 indicates an average stock return of 27%, suggesting a generally positive return. The data show moderate dispersion, with a standard deviation of 67%. The median (15%) indicates possible asymmetry in the distribution, and the range of values reveals a widespread. These findings align with those of Soares and Galdi (2011), who identified a mean return of 24% with a standard deviation of 75%.
The average residual income is positive at 5.2%, with a closely aligned median. The standard deviation implies some variability, although not excessive. The maximum value of 368% indicates at least one extreme outlier. Overall, residual income appears asymmetrically distributed, concentrated near zero, with extreme positive and negative values. The study by Nissim and Penman (2001), which also employs RNOA, reports a similar average margin of 6.2%.
Regarding return on assets, the average ROA is 5.5%, reflecting modest profitability. The proximity between the mean and median suggests a relatively symmetric distribution. However, the standard deviation and value range indicate the presence of outliers. The positive ROA contrasts with the negative averages found in Oliveira (2017) and Soares and Galdi (2011), possibly explained by the broader time frame of this research.
On average, firms are not highly leveraged, with third-party capital accounting for approximately 61.2% of total assets — a value consistent with findings in the U.S. market (Nissim & Penman, 2001).
The average SIZE (log of total assets) of 22.2 reflects the growth of Brazilian firms compared to earlier studies like Santos et al. (2018). Regarding liquidity, on average, companies maintain current assets twice the value of current liabilities. A notable maximum suggests the presence of outliers, and Guasti and Pianca (2022) confirm similar values in key sectors.
The COVID-19 dummy variable averages 37.5%, indicating a moderate representation of the pandemic period within the sample. The relatively high standard deviation suggests variability across firms and periods.
4.3 Correlation Analysis of Independent Variables
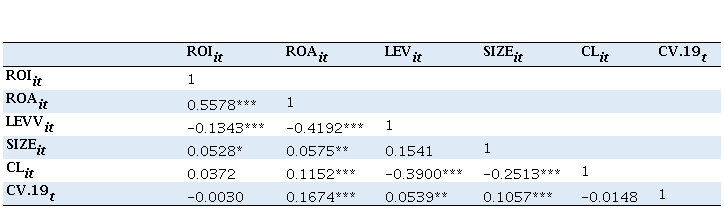
Table 5 presents Pearson correlation coefficients among the independent variables.
Pearson Correlation Matrix
Source: Author's elaboration.Note: Note: R is stock return; ROI is residual operating income; ROA is return on assets; LEV is leverage; SIZE is firm size; CR is current ratio; CV-19 is the pandemic dummy; i is the firm in period t. *** p < 0.01; ** p < 0.05; * p < 0.10.
The ROI shows a significant and positive correlation (0.5578) with ROA, suggesting that companies with higher returns on assets tend to have higher residual income, indicating operational efficiency. On the other hand, it shows a significant and negative correlation (-0.1343) with LEV, suggesting that less leveraged companies may generate higher residual income. Additionally, there is a significant positive correlation between SIZE and CL. The relationship with the variable related to CV.19 is non-significant and negative.
ROA has a significant and positive correlation (0.5578) with ROI and a significant and negative correlation (-0.4192) with LEV. It also shows significant positive correlations with SIZE and CL, indicating that more prominent and more liquid companies tend to have higher ROA. The relationship with the variable related to COVID-19 is significant and positive (0.1674). The study by Santos et al. (2018) also found a positive correlation between ROA and SIZE.
LEV shows a significant negative correlation with ROI (-0.1343), ROA (-0.4192), and LC (-0.3900). The correlation with SIZE is positive but not significant (0.1541). The relationship with the variable related to CV.19 is positive and significant (0.0539), suggesting that leverage may have behaved differently during the crisis. The correlation between LEV and ROI reinforces the findings of Nissim and Penman (2001), who found a negative correlation of -0.02 between FLEV and PM.
SIZE shows a significant positive correlation with ROI and ROA (0.0575). Additionally, it exhibits a significant negative correlation with CL (-0.3900). The relationship with LEV is non-significant, while the correlation with the variable related to CV.19 is positive and significant.
CL has a significant positive correlation (0.1152) with ROA and significant negative correlations with LEV and SIZE. The relationship with the variable related to CV.19 is non-significant (-0.0148). The variable associated with CV.19 does not show significant correlations with ROI or CL but has significant positive correlations with ROA, LEV, and SIZE.
4.4 Regression Analysis
At this research stage, the objective was to identify the regression model that best fits the collected data. The results showed that the data do not follow a normal distribution and exhibit heteroskedasticity, making the use of Ordinary Least Squares (OLS) inappropriate. Thus, quantile regression was deemed the most suitable method, given that this approach is robust to non-normality and heteroskedasticity (Cameron & Trivedi, 2005).
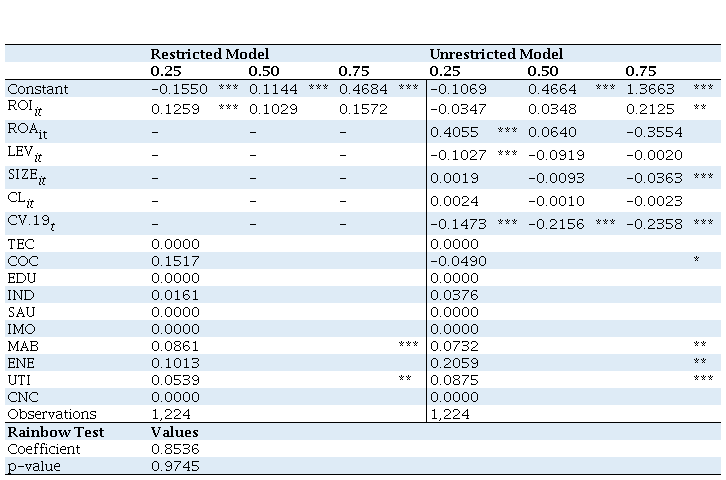
Table 6 presents the quantile regression estimates, using panel data with fixed effects, for both the restricted and unrestricted models, along with p-values, the number of observations, and the model specification test. In the restricted model, only the main study variables, such as stock return (R), residual operating income (ROI), and sector dummies, are included to control for fixed effects. As detailed in the table notes, the unrestricted model also incorporates control variables.
Quantile Regression – Panel Data with Fixed Effects
Source: Author's elaboration.Note: R = stock return; ROI = residual operating income; ROA = return on assets; LEV = leverage; SIZE = firm size; CR = current ratio; COVID-19 = pandemic dummy. Sector dummies included: CNC (non-cyclical consumption), COC (cyclical consumption), ENE (energy), IMO (real estate), IND (industrial), MAB (basic materials), SAU (health), TEC (technology), and UTI (utilities). *** p < 0.01; ** p < 0.05; * p < 0.10.
The results in Table 6 indicate that the coefficients and significance levels vary depending on the quantile analyzed. In the restricted model, the intercept is significant across all quantiles. For the lowest quantile (Q25), the absence of ROI reduces the stock return by -0.1550, while in the Q50 and Q75 quantiles, the intercept reflects a positive impact when the independent variables are null.
ROI is significant only in the 0.25 quantile in the restricted model, indicating that a one-unit increase in ROI results in a 0.1259 increase in R at this quantile. This aligns with Nissim and Penman's (2001) and Soares and Galdi (2011) findings. Regarding sectors, the effects on R are not constant over time, particularly in the basic materials and utilities sectors.
In the unrestricted model, for Q25 (lower returns), the constant and the variables ROA, LEV, and CV.19 are statistically significant. ROA shows a positive relationship (0.4055) with stock returns, supporting the results found in Malta and Camargo (2016), Pletsch and Rita (2018), and Santos et al. (2018) while contradicting Oliveira (2017). LEV has a negative impact (-0.1027), which aligns with previous findings (Guasti & Pianca, 2022). The COVID-19 variable negatively affects returns, reinforcing evidence that the pandemic decreased asset returns (Guasti & Pianca, 2022).
At the 0.50 quantile, only the intercept (0.4664) and the CV.19 variable (-0.2156) are statistically significant. The pandemic's stronger negative impact at the median return level suggests investors reacted more intensely to average-performance stocks than to low-return ones.
At the upper quantile (Q75), the ROI, SIZE, and CV.19 variables are significant. ROI has a positive relationship with higher returns, supporting the hypotheses of Nissim and Penman (2001) and Soares and Galdi (2011). This may be attributed to ROI's clean nature, reflecting only core business operations and accounting for the cost of equity and debt. This robustness suggests greater efficiency in forecasting stock returns, assuming that investors perceive ROI as value-generating (Nissim & Penman, 2001). Firms with high returns and high ROI are more likely to continue delivering value.
The SIZE variable is negatively associated with stock returns, diverging from most prior studies, which found that larger firms tend to yield higher returns (Bastos et al., 2019; Santos et al., 2018). However, Nissim (2021) notes that large firms often see declining performance over time due to competition and globalization, providing opportunities for smaller firms to outperform.
The CV.19 variable is significant across all quantiles, partially aligning with Guasti and Pianca (2022), who observed significance in some sectors. Its consistent negative impact reflects the systemic nature of the pandemic, which led to investor aversion and supports the idea of a structural break in financial markets (Rinaldi et al., 2020).
The current ratio (CR) is insignificant in any quantile, consistent with prior studies (Carvalho et al., 2023; Malta & Camargo, 2016). Regarding sector-specific results, sectors such as cyclical consumption, energy, basic materials, and utilities show non-constant effects over the years analyzed, suggesting the need for more detailed investigation.
The overall analysis supports the study's hypothesis, indicating that ROI, calculated from RNOA and WACC, is positively and significantly associated with stock returns in the 0.25 and 0.75 quantiles of companies listed on the Brazilian stock market.
These findings provide practical implications for investors, analysts, and corporate managers. For investors and analysts, the study suggests that ROI is a meaningful metric for identifying firms with high value-generation potential. This allows investors to target companies using their operating assets efficiently, resulting in better stock market performance. ROI (via RNOA) can thus be a strategic tool for making more informed investment decisions.
For managers, the results highlight that managing ROI—reflected through RNOA—may be key to maximizing shareholder returns. Firms with high RNOA tend to perform better, suggesting that managers should optimize operational assets and enhance internal efficiency. In times of economic uncertainty, such as during the pandemic, ROI may help identify resilient firms capable of continuing to create value under adverse conditions. Therefore, investors and managers can benefit from ROI as a strategic performance indicator for financial decision-making.
4.5 Additional Tests
This section explores the behavior of the data over time through time series analysis without, however, extrapolating to forecast future variables. The period considered in this analysis covers stock returns and operational residual income from 2015 to 2022, using the same number of observations as in the regression analysis.
Figure 1 illustrates the dynamics of these variables over the analyzed period. The y-axis represents the values, while the x-axis corresponds to the years. The blue lines represent operational residual income, whereas the red lines depict the entities' stock returns.
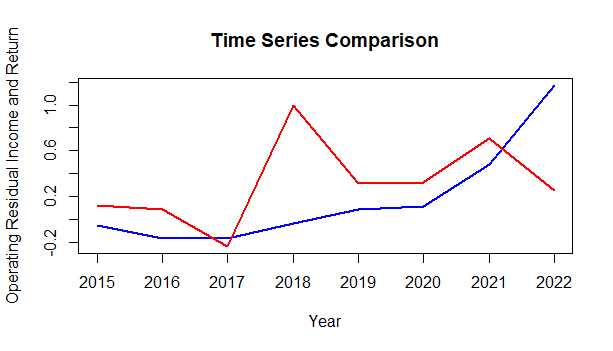
Figure 1
Time Series Comparison – Stock Return vs. Operational Residual Income from 2015 to 2022.
Source: Author's elaboration.
Stock returns exhibited considerable fluctuation during the analyzed period, registering negative values only in 2017, influenced by the lingering effects of the 2016 crisis (Carvalho et al., 2023). In contrast, operational residual income showed a more stable and consistent evolution, a characteristic attributed to its nature as a metric that includes only essential business information (Nissim & Penman, 2001).
When comparing the time series, it is noticeable that stock returns tend to follow a similar trend to operational residual income, except for the years 2017 and 2022. It is particularly noteworthy that, in 2018, stock returns — previously negative — shifted to positive in an anomalous manner, which was corrected in subsequent years.
Thus, the graphs provide valuable insights. In 2017, it becomes evident that investors could have opted to acquire shares with residual income higher than their returns, thereby obtaining positive gains in the following period. In 2022, market agents would have had the opportunity to execute short-selling operations on stocks with returns lower than residual income, generating abnormal profits. Both strategies could have resulted in abnormal returns, highlighting the phenomenon of mean reversion (Fama & French, 2000).
Opportunities for abnormal returns through “long and short” operations are considered market anomalies, in which agents can outperform the market average. This challenges the Efficient Market Hypothesis proposed by Fama (1970), which asserts that consistently achieving abnormal returns in the long run is unfeasible.
5 CONCLUSIONS
The literature suggests that accounting ratios are fundamental to understanding an organization (Carvalho et al., 2023). However, accounting metrics focused exclusively on a company's operational activities may be more useful for stakeholders when forecasting asset returns (Nissim & Penman, 2001). Based on this premise, this research aimed to investigate the explanatory power of operational residual income, measured using RNOA and WACC, in relation to stock returns from 2015 to 2022.
Statistical evidence suggests that operational residual income, calculated based on RNOA and WACC, explains the variations in stock returns observed in the 0.25 and 0.75 quantiles, aligning with international literature (Nissim & Penman, 2001). The relationship was not significant at the 0.50 quantile. These results provide empirical support for not rejecting the research hypothesis.
Another relevant finding was the significant and negative association of COVID-19 with stock returns across all quantiles, indicating that the pandemic had a substantial impact on firms within the financial market. The sensitivity of returns to the pandemic can be explained by economic uncertainty and the high levels of corporate indebtedness during the crisis (Guastin & Pianca, 2022; Rinaldi et al., 2020).
Thus, within the scope of existing literature, this study contributes to advancing accounting research related to capital markets and introduces metrics such as RNOA and operational residual income, which have not yet been employed in the Brazilian research context.
From a practical standpoint, these indicators may be relevant for the decision-making process of both individual and institutional investors and for supporting financial analysts in their recommendations, given that these metrics are based solely on essential business information. Furthermore, investors and financial analysts may adopt RNOA and operational residual income as new profitability metrics. These novel measures have greater predictive power, reflecting the assets directly linked to a firm's operational activities and considering both the cost of equity and debt capital, thereby reducing risk in decision-making processes.
For corporate managers, these indicators can be instrumental in decisions concerning the efficiency of operational assets. By comparing RNOA to WACC, they can assess whether such assets are genuinely creating value. Additionally, these metrics can help identify the appropriate timing for investing in operational assets based on the signals provided by RNOA and operational residual income.
Finally, managers, analysts, and investors can identify companies that demonstrate greater resilience in periods of adverse market conditions, such as the COVID-19 pandemic. This is essential for strategic decision-making during times of economic uncertainty.
Further, regarding practical implications, analyzing operational residual income simplifies the valuation process for those relying on fundamental analysis. The required restatement of financial statements is straightforward, as is the calculation of WACC. Thus, valuation models adapted from the Residual Income Valuation (RIV) and Abnormal Earnings Growth (AEG) methods, widely discussed in the literature (Ohlson, 1995; Ohlson, 2005), may serve as practical "rules of thumb" for estimating a firm's intrinsic equity value, as it would suffice to add the capitalization of residual Net Operating Profit after Taxes (ReNOPAT/WACC-g) to book value.
This value can be continuously compared to market price, allowing for the identification of investment opportunities. Moreover, the economic value per share could become even more dynamic if updated quotes from Interbank Deposit (DI) futures contracts were used instead of the CAPM formula's risk-free rate (Rf).
In addition, fundamentalist filters can be employed by ranking companies from highest to lowest in terms of percentage operational residual income (%) to build "long and short" strategies—buying firms with higher residual income and shorting those with lower levels.
The time series analysis revealed that operational residual income followed a stable and upward trajectory between 2015 and 2022. In contrast, stock returns were more volatile, with negative values in 2017—reflecting the lingering effects of the 2016 crisis—and an atypical behavior in 2022, influenced by post-pandemic recovery and political uncertainties. There was general alignment between the two variables, with exceptions occurring in those two years, suggesting that stock returns often follow operational residual income, though divergences can happen in times of instability.
The year 2017 was marked by the residual effects of the 2016 crisis. The Brazilian economy was still struggling with the recession of 2015–2016, characterized by high unemployment, low GDP growth, and political uncertainty, culminating in President Dilma Rousseff's impeachment. Moreover, the ongoing Lava Jato (Car Wash) corruption investigations contributed to a volatile market environment and increased risk perception among foreign investors.
As for 2022, Brazil and the world were in a post-pandemic recovery phase characterized by inflation and rising interest rates. Additionally, the war in Ukraine, which began in February 2022, fueled global market instability. Despite some Brazilian companies benefiting from the increase in commodity prices, the overall international environment remained challenging.
Despite the findings, this study has limitations, such as a small sample size due to the unavailability of some data in the Refinitiv Eikon © system, limited statistical tools suitable for the dataset, and a relatively short time frame, due to the recent convergence of Brazilian accounting standards with international norms. Furthermore, since this study focuses solely on the Brazilian stock market, the generalizability of the results is limited.
For future research, we suggest examining the relationship between returns and residual income across sectors such as cyclical consumer goods, basic materials, energy, and utilities—considering that the effect on returns has not been constant over the years. Further investigation into the impacts of the COVID-19 pandemic is also encouraged, as well as exploration of the relationship between operational residual income and abnormal stock returns. Moreover, given that return volatility is significantly higher than residual income, future studies could assess the potential for generating abnormal returns through "long and short" strategies based on operational residual income.
REFERENCES
Amir, E., Kama, I., & Livnat, J. (2011). Conditional versus unconditional persistence of RNOA components: Implications for valuation. Review of Accounting Studies, 16, 302-327. https://doi.org/10.1007/s11142-010-9138-z
Bastos, D. D., Nakamura, W. T., David, M., & Rotta, U. A. S. (2009). A relação entre o retorno das ações e as métricas de desempenho: Evidências empíricas para as companhias abertas no Brasil. Revista de Gestão, 16(3), 65-79. https://doi.org/10.5700/rege373
Bastos, E. V. P., Matos, V. S., & Macedo, M. Á. S. (2019). Relevância da informação contábil de lucro e fluxo de caixa: Um estudo com foco em ações ordinárias e preferenciais. Revista de Gestão dos Países de Língua Portuguesa, 18(2), 104-125. https://doi.org/10.12660/rgplp.v18n2.2019.78785
Cameron, A. C., & Trivedi, P. K. (2005). Microeconometrics Methods and Applications. Cambridge University Press (1.ed.). New York: Cambridge University Press
Campos, O. V., Lamounier, W. M., & Bressan, V. G. F. (2012). Retornos das ações e o lucro: Avaliação da relevância da informação contábil. Revista de Contabilidade e Organizações, 6(16), 20-38. https://doi.org/10.11606/rco.v6i16.52665
Carvalho, L., Barbosa, I., & Cunha, M. E. S. (2023). Valor de mercado e crise: Evidências para empresas brasileiras de capital aberto. Revista de Auditoria Governança e Contabilidade, 11(46), 1-14. https://revistas.fucamp.edu.br/index.php/ragc/article/view/3044
Collins, D. W., Maydew, E. L., & Weiss, I. S. (1997). Changes in the value-relevance of earnings and book values over the past forty years. Journal of Accounting and Economics, 24(1), 39-67. https://doi.org/10.1016/S0165-4101(97)00015-3
Fama, E. F. (1970). Efficient capital markets: A review of theory and empirical work. The Journal of Finance, 25(2), 28-30. https://doi.org/10.2307/2325486
Fama, E. F., & French, K. R. (2000). Forecasting profitability and earnings. The Journal of Business, 73(2), 161-175. https://doi.org/10.1086/209638
Feltham, G. A., & Ohlson, J. A. (1995). Valuation and clean surplus accounting for operating and financial activities. Contemporary Accounting Research, 11(2), 689-731. https://doi.org/10.1111/j.1911-3846.1995.tb00462.x
Guastin, F. R., & Pianca, O. J. B. (2022). Efeito dos indicadores econômico-financeiros no preço das ações de empresas listadas na B3. Pretexto, 23(4), 9-32. http://revista.fumec.br/index.php/pretexto/article/view/8582
Jensen, M. C., & Meckling, W. H. (1976). Theory of the firm: Managerial behavior, agency costs and ownership structure. Journal of Financial Economics, 3(4), 305-360. https://doi.org/10.1016/0304-405X(76)90026-X
Klingenberg, B., Timberlake, R., Geurts, T. G., & Brown, R. J. (2013). The relationship of operational innovation and financial performance — A critical perspective. International Journal of Production Economics, 142(2), 317-323. https://doi.org/10.1016/j.ijpe.2012.12.001
Kothari, S. P., & Wasley, C. (2019). Commemorating the 50-year anniversary of Ball and Brown (1968): The evolution of capital market research over the past 50 years. Journal of Accounting Research, 57(5), 1117-1159. https://doi.org/10.1111/1475-679X.12287
Lopes, A. B. (2001). A relevância da informação contábil para o mercado de capitais: O modelo de Ohlson aplicado a Bovespa (Tese de Doutorado). Universidade de São Paulo, São Paulo, SP. https://doi.org/10.11606/T.12.2001.tde-02062020-174635
Malta, T. L., & Camargos, M. A. (2016). Variáveis da análise fundamentalista e dinâmica e o retorno acionário de empresas brasileiras entre 2007 e 2014. REGE - Revista de Gestão, 23(1), 52-62. https://doi.org/10.1016/j.rege.2015.09.001
Marteletto, S. R. (2022). Técnicas de seleção de atributos através de Random Forests: um estudo de caso para detecção de tendências em séries temporais financeiras (Dissertação de Mestrado). Universidade de São Paulo, São Paulo, SP. https://doi.org/10.11606/D.100.2022.tde-08032023-134543
Morris, R. D. (1987). Signalling, Agency Theory and Accounting Policy Choice. Accounting and Business Research, 18(69), 47-56. https://doi.org/10.1080/00014788.1987.9729347
Nissim, D. (2021). Steady-state Growth. Columbia Business School Research Paper. https://doi.org/10.2139/ssrn.3898767
Nissim, D., & Penman, S. H. (2001). Ratio analysis and equity valuation: From research to practice. Review of Accounting Studies, 6(1), 109-154. https://doi.org/10.1023/A:1011338221623
O’hanlon, J., & Peasnell, K. (2002). Residual income and value-creation: The missing link. Review of Accounting Studies, 7, 229-245. https://doi.org/10.1023/A:1020230203952
Ohlson, J. A. (1995). Earnings, book values, and dividends in equity valuation. Contemporary Accounting Research, 11(2), 661-687. https://doi.org/10.1111/j.1911-3846.1995.tb00461.x
Oliveira, J. F. R., Viana, D. B. C., Junior, Ponte, V. M. R., & Domingos, S. R. M. (2017). Indicadores de desempenho e valor de mercado: Uma análise nas empresas listadas na BM&FBOVESPA. Revista Ambiente Contábil, 9(2), 240-258. https://doi.org/10.21680/2176-9036.2017v9n2ID10787
Pletsch, C. S., & Ritta, C. O. (2018). Relação entre indicadores de desempenho financeiro e retorno de ações no mercado brasileiro (2008-2013). In A. T. B. B. Dias & C. O. Ritta (Orgs.), Saberes Contábeis 5 (pp.87-112). Curitiba: Multideia. https://www.researchgate.net/publication/328462558_Saberes_Contabeis_v5
Rinaldi, L., Cho, C. H., Lodhia, S. K., Michelon, G., & Tilt, C. A. (2020). Accounting in times of the COVID-19 pandemic: A forum for academic research. Accounting Forum, 44(3), 180-183. https://doi.org/10.1080/01559982.2020.1778873
Santos, J. V. J., Tavares, A. L., Azevedo, Y. G. P., & Freitas, R. M., Neto. (2018). Relação entre o retorno das ações e o Economic Value Added (Eva): Evidências empíricas em companhias abertas no Brasil. Revista Evidenciação Contábil & Finanças, 6(1), 119-131. https://doi.org/10.18405/recfin20180107
Soares, E. R., & Galdi, F. C. (2011). Relação dos modelos DuPont com o retorno das ações no mercado brasileiro. Revista Contabilidade & Finanças, 22(57), 279-298. https://doi.org/10.1590/S1519-70772011000300004
Souza, C. C., Carneiro, J. B. A., Junior, Cristaldo, M. F., Castelão, R. A., Frainer, D. M., & Viganó, H. H. G. (2022). Forecast of the production of sugarcane and its derivatives, through ARIMA, in the period from 2020 to 2025 in the Centro-South macroregion of Brazil. Research, Society and Development, 11(4), e6211427048. https://doi.org/10.33448/rsd-v11i4.27048
Subedi, M., & Farazmand, A. (2020). Economic Value Added (EVA) for performance evaluation of public organizations. Public Organization Review, 20, 613-630. https://doi.org/10.1007/s11115-020-00493-2
Suhadak, S., Kurniaty, K., Handayani, S. R., & Rahayu, S. M. (2018). Stock return and financial performance as moderation variable in influence of good corporate governance towards corporate value. Asian Journal of Accounting Research, 4(1), 18-34. https://doi.org/10.1108/AJAR-07-2018-0021
Vorst, P., & Yohn, T. L. (2018). life cycle models and forecasting growth and profitability. The Accounting Review, 93(6), 357-381. https://doi.org/10.2308/accr-52091
Wang, J., Fu, G., & Luo, C. (2013). Accounting information and stock price reaction of listed companies — Empirical evidence from 60 listed companies in Shanghai stock exchange. Journal of Business & Management, 2(2), 11-21. https://doi.org/10.12735/jbm.v2i2p11
Información adicional
redalyc-journal-id: 5707
